Free tool · Stethon Digital Marketing
Healthcare Social Media Advertising Calculator
Ad cost, new patients and advertising revenue for your practice
This healthcare social media advertising calculator models Facebook, Instagram, TikTok, YouTube and LinkedIn ads against Google Search, from CPM to booked patients. Set a target ROI and see exactly what you can afford to pay per click, lead and patient.
Platform & budget
Fees default to Stethon’s published starting prices: Meta ads from $2,500/mo, Google Ads from $1,000/mo. Edit them to compare any agency or in-house cost. Ad spend is paid to the platform directly.
Ad delivery & landing page
Front desk & treatment
Growth levers: switch on what you already do or plan to add
Patient value & margin
12-month revenue
–
Lifetime revenue
–
Break-even ROAS
–
Lifetime gross profit
–
Your target
Bid ceilings
What you can afford to pay
The most you can pay at each stage of the funnel and still hit your target ROI, after margin and fees.
Full funnel
From impression to new patient
Every stage your ad budget moves through, with the conversion rate and cost at each step.
Platforms
Compare every platform on the same budget
Healthcare benchmark CPM, CTR and conversion per platform, with your patient economics.
Forecast
Growth & payback timeline
Cumulative spend vs. gross profit from the patients your ads bring in, including the learning phase.
Sensitivity
What if CPM or conversion moves?
ROI when your CPM or landing page conversion shifts. Your current scenario is outlined.
How to read it: columns move CPM, rows move landing page conversion. A better landing page usually beats a cheaper CPM, which is why conversion work pays back faster than bid tweaks.
Growth levers
Biggest wins without more ad spend
Gross profit each fix adds per year of new patients.
Step 1 of 2 · Your forecast
Get this forecast and a custom ad plan
Send us the numbers you just built, then complete a short clinic audit on the next page. We use both to build your plan: the right platform mix, a realistic cost per patient, and the fixes that would lift your ROI the most.
New patients / mo
–
Ad revenue / mo
–
ROAS
–
Max cost per lead
–
Where should we send it?
Your scenario is attached automatically. Next, a short clinic audit so we can plan on real numbers.
No spam. Please don’t include patient information. See our privacy policy.
How to use it
How to Use the Healthcare Social Media Advertising Calculator
The healthcare social media advertising calculator follows the path a patient takes through your marketing. Every field starts at a benchmark for your specialty, so you only change what you know.
Pick specialty and platform
Load benchmarks for 25 specialties, then choose Facebook, Instagram, TikTok, YouTube, LinkedIn or Google Search.
Enter spend and delivery
Ad spend, CPM, click-through rate and landing page conversion give you clicks, leads and cost per lead.
Add front desk and patient value
Booking, show and acceptance rates turn leads into patients. Revenue, retention and margin turn patients into profit.
Set your target ROI
See the most you can pay per click, lead and patient, plus the highest budget that still hits your target.
Formulas
Healthcare Social Media Advertising Formulas
The math behind every number in the calculator. Use it to check any platform report or agency proposal.
Impressions
Ad spend ÷ CPM × 1,000
How many times your ads are shown.
Cost per click
CPM ÷ (CTR × 1,000)
What each visit to your landing page costs.
Cost per lead
CPC ÷ landing page conversion
What each form, call or chat costs.
Cost per new patient
All-in cost ÷ new patients
Ad spend plus fees, divided by patients who start care.
Advertising revenue
New patients × 12-month revenue
Revenue your ads generate in the first year.
ROAS
Advertising revenue ÷ ad spend
Revenue returned per dollar of media.
Break-even ROAS
(All-in cost ÷ ad spend) ÷ margin
The ROAS you need before ads make money.
Max cost per lead
(Profit ÷ (1 + target ROI) − fees) × lead-to-patient rate
The ceiling that keeps you at your target.
Worked example
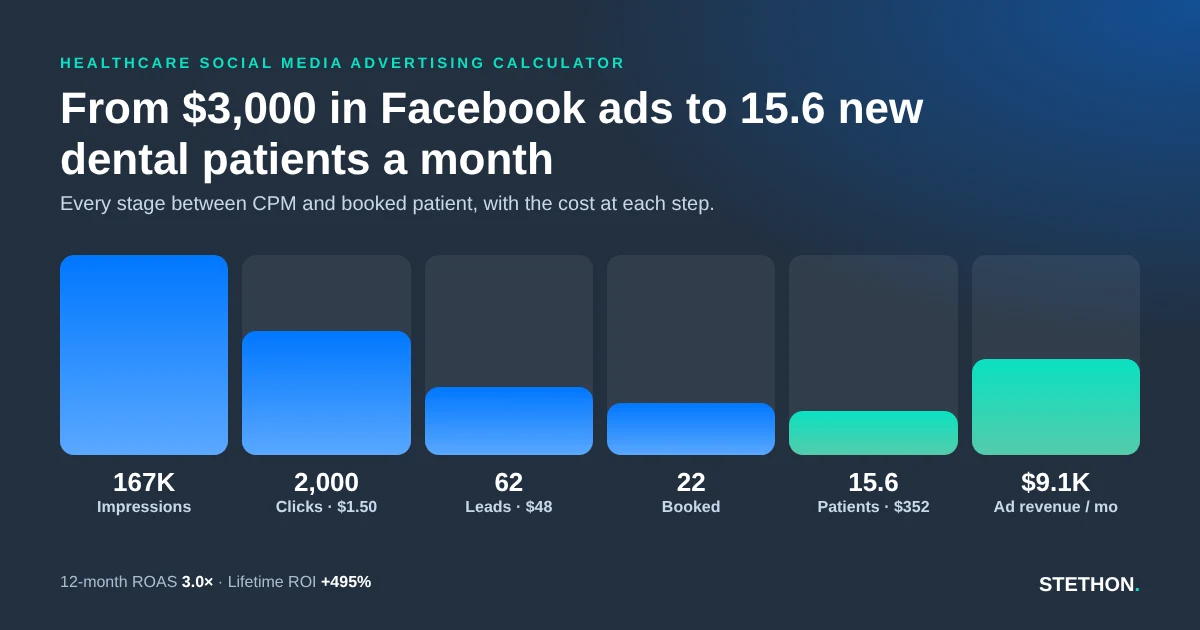
A general dentist spending $3,000 a month on Facebook
12-month ROAS is 3.0×, below the 4.6× break-even for a 40% margin practice. Over a 7-year patient relationship each patient is worth $2,095 in gross profit, so the same campaign returns +495% on lifetime profit. That gap is why dental and other retention-driven practices should judge social ads on lifetime value, not first-month revenue.
Platform benchmarks
Healthcare Social Media Advertising Benchmarks by Platform
Typical 2025–2026 costs for medical practices, and the defaults the healthcare social media advertising calculator loads for each platform. Facebook delivers the cheapest healthcare leads, Google Search the highest intent, and LinkedIn costs three to four times more per lead. Sources: LocaliQ Facebook benchmarks and WordStream Google Ads benchmarks, plus Stethon campaign data.
| Platform | CPM | Click-through rate | Cost per click | Click → lead | Cost per lead |
|---|---|---|---|---|---|
| $15–22 | 1.2–4.2% | $1.50–1.70 | 6–8% | $32 physicians · $62 dentists | |
| $8–15 | 0.6–1.0% | $1.30–3.35 | 4–6% | $45–65 | |
| TikTok | $4–9 | 0.5–0.7% | $0.30–1.50 | 2–4% | $40–90 |
| YouTube | $5–10 | 0.45–0.65% | $1.00–3.00 | 2–4% | $60–120 |
| $30–45 | 0.5–0.6% | $3.90–7.00 | 6–10% (lead forms) | $100–150 | |
| Google Search (comparison) | n/a | 5.7–6.6% | $4.76 physicians · $8.00 dentists | 10.7–12.4% | $40 physicians · $73 dentists |
Advertising revenue
Healthcare Advertising Revenue Calculator: What Your Ads Really Earn
Advertising revenue is the patient revenue your ads produce, not what a publisher earns from showing ads. For a medical practice it equals new patients from ads multiplied by what each patient pays you. The healthcare advertising revenue calculator above reports it on 12-month revenue, so it lines up with the ROAS figure in Meta Ads Manager and Google Ads.
Revenue alone can mislead. A $9,000 month looks strong until you subtract clinical costs and fees. That is why the calculator pairs advertising revenue with break-even ROAS and ROI after gross margin, and lets you measure ROI on the first 12 months or the full patient lifetime.
If you already track lifetime value per patient, switch the patient value card to “I know my LTV” and enter it directly. Otherwise build it from first-year revenue, retention and referrals. Prefer to have the numbers worked for you? Our healthcare Meta ads team runs this model on your real account data.
Advertising revenue vs. ROAS vs. ROI
Advertising revenue is dollars in. ROAS is revenue per dollar of media. ROI is profit after margin and every cost, including fees. Only ROI tells you whether to spend more.
Break-even ROAS
Divide all-in cost by ad spend, then by gross margin. A 40% margin practice paying $2,500 in fees on $3,000 of spend needs about 4.6× ROAS on 12-month revenue just to break even.
Why lifetime value changes the answer
Dental, primary care and med spa patients come back for years. Judged on first-year revenue they can look unprofitable while returning several times their cost over the relationship.
Specialty benchmarks
Facebook Advertising Benchmarks by Medical Specialty
Calculator defaults for each specialty on Facebook at $3,000 or more in monthly ad spend, single location, Stethon starting fees, all growth levers off.
| Specialty | Facebook cost per lead | Lead → patient | Cost per new patient | 12-month revenue per patient | 12-month ROAS |
|---|---|---|---|---|---|
| General & family dentistry | $48 | 25.2% | $352 | $585 | 3.0× |
| Dental implants & cosmetic | $75 | 10.4% | $1,236 | $4,275 | 5.9× |
| Orthodontics | $45 | 15.2% | $548 | $5,225 | 17.5× |
| Plastic surgery | $71 | 6.6% | $1,597 | $9,000 | 8.5× |
| Med spa & aesthetics | $35 | 17.8% | $360 | $900 | 4.6× |
| Hair transplant | $61 | 6.6% | $1,491 | $10,000 | 10.9× |
| LASIK & refractive surgery | $39 | 14.3% | $506 | $4,200 | 15.2× |
| Dermatology | $35 | 25.2% | $254 | $340 | 2.5× |
| TRT, HRT & men’s health | $45 | 14.6% | $570 | $1,200 | 3.9× |
| Medical weight loss & GLP-1 | $37 | 15.8% | $396 | $1,500 | 6.5× |
| Chiropractic | $35 | 21.7% | $295 | $765 | 4.8× |
| Physical therapy | $30 | 24.6% | $224 | $1,120 | 9.2× |
| Pain management | $50 | 17.1% | $537 | $1,440 | 4.9× |
| Orthopedics & sports medicine | $71 | 16.0% | $819 | $2,800 | 6.3× |
| Podiatry | $35 | 26.1% | $245 | $510 | 3.8× |
| Primary care & family medicine | $39 | 26.0% | $278 | $298 | 2.0× |
| Urgent care | $30 | 44.6% | $123 | $187 | 2.8× |
| Cardiology | $60 | 26.1% | $421 | $1,200 | 5.2× |
| Audiology, hearing & ENT | $45 | 11.7% | $712 | $4,275 | 11.0× |
| Mental health & psychiatry | $60 | 21.7% | $507 | $1,360 | 4.9× |
| Addiction treatment | $127 | 7.6% | $2,710 | $17,500 | 10.5× |
| ABA therapy | $79 | 7.1% | $2,044 | $25,500 | 22.9× |
| Fertility & IVF | $127 | 9.1% | $2,258 | $13,500 | 9.7× |
| Senior living & home care | $60 | 1.6% | $6,767 | $55,000 | 14.9× |
| Other / multi-specialty | $39 | 23.1% | $313 | $680 | 4.0× |
Next steps
Turn the Forecast Into a Plan
The calculator shows what paid social can do. These are the services that make the numbers real.
Paid social
Healthcare Meta ads
Facebook and Instagram campaigns built around booked appointments, not clicks.
Learn more →Paid search
Healthcare Google Ads
Capture patients already searching for your services, with compliant tracking.
Learn more →Short-form video
TikTok & YouTube ads
Reach younger, cash-pay patients for aesthetics, wellness and men’s health.
Learn more →Organic
Healthcare SEO
Rank in Google and the Map Pack so cost per patient falls as organic leads grow.
Learn more →AI search
Healthcare GEO
Get your practice cited when patients ask ChatGPT, Gemini and AI Overviews.
Learn more →Free audit
Free clinic audit
A review of your market, competitors, campaigns and front desk, at no cost.
Learn more →FAQ
Healthcare Social Media Advertising: Common Questions
How much should a medical practice spend on social media advertising?
Most single-location practices start at $3,000 to $5,000 a month in ad spend per platform. That gives the platform enough data to optimize and produces a steady flow of leads. The scale ceiling in the calculator shows how far you can push spend before rising CPMs pull ROI below your target.
What is a good ROAS for healthcare social media ads?
It depends on your margin. Break-even ROAS is 1 divided by gross margin, adjusted for fees, so a 50% margin practice breaks even at 2× on media alone. Most healthcare advertisers aim for 3× to 5× on 12-month revenue, or a 3:1 ratio of lifetime gross profit to cost.
How do you calculate advertising revenue for a medical practice?
Multiply new patients from ads by the revenue each patient brings in. Fifteen new patients a month worth $585 each in their first year is $8,775 in monthly advertising revenue. Divide that by ad spend to get ROAS.
What is a good cost per lead for healthcare Facebook ads?
LocaliQ’s 2026 data puts the average at about $32 for physicians and $62 for dentists. Your maximum matters more than the average: lifetime gross profit divided by one plus your target ROI, minus fees, multiplied by your lead-to-patient rate. The calculator shows it as max cost per lead.
Which social media platform is best for healthcare advertising?
Facebook and Instagram produce the cheapest patient leads for most practices. TikTok and YouTube suit younger, cash-pay services like aesthetics and men’s health. LinkedIn fits B2B healthcare more than patient acquisition. Google Search usually converts best because patients are already looking, so compare all six on your own numbers in the platform table.
Are social media ads HIPAA compliant?
The ads can be. Tracking is where practices get into trouble: pixels and tags on pages that collect health information can send protected data to Meta or Google. Use HIPAA-aware tracking, keep health conditions out of custom audiences, and avoid copy that implies you know a viewer’s condition.
Want this forecast built on your real numbers?
Send us the scenario you built and complete your free clinic audit. We review your ad accounts, landing pages and front-desk conversion, then come back with a fixed proposal and a projected cost per patient for each platform.